VSCodeでVirtualBox上のPHPをデバッグしてみる
リモート側
とりあえずVagrantでCentOS8を起動。
Vagrant.configure("2") do |config|
  config.vm.box = "bento/centos-8.3"
  config.vm.network "private_network", ip: "192.168.33.10"
  config.vm.synced_folder ".", "/vagrant", type:"virtualbox"
  config.vm.provision "shell", inline: <<-SHELL
    dnf install -y git zip unzip php php-json php-mbstring php-xml php-zip php-pdo php-mysqlnd
    curl -sS https://getcomposer.org/installer | php
    mv composer.phar /usr/local/bin/composer
  SHELL
end
> vagrant up
> vagrant ssh
php-develとphp-pearが必要になるみたいなので、なければ入れておく。
$ sudo dnf install -y php-devel php-pear
Xdebugをインストール。
$ sudo pecl install xdebug
・・・
Build process completed successfully
Installing '/usr/lib64/php/modules/xdebug.so'
install ok: channel://pecl.php.net/xdebug-3.0.2
configuration option "php_ini" is not set to php.ini location
You should add "zend_extension=/usr/lib64/php/modules/xdebug.so" to php.ini
php.iniに下記を追加。
(Xdebugのバージョン3の書き方になっています)
$ sudo vi /etc/php.ini
・・・
[xdebug]
zend_extension=/usr/lib64/php/modules/xdebug.so
xdebug.mode=debug
xdebug.client_host=10.0.2.2
xdebug.start_with_request=yes
ちなみに、「10.0.2.2」はホスト側のIPアドレス。VirtualBoxではデフォルトこの値みたい。
routeコマンドで確認すると、defaultのゲートウェイは_gatewayになっており、
「-n」をつけてIPを表示すると、「10.0.2.2」になっているので、これがホストのIPアドレスっぽい。
(ネットワークに関しては完全な初心者なのでよく分ってはいない)
$ route
Kernel IP routing table
Destination     Gateway         Genmask         Flags Metric Ref    Use Iface
default         _gateway        0.0.0.0         UG    100    0        0 eth0
10.0.2.0        0.0.0.0         255.255.255.0   U     100    0        0 eth0
192.168.33.0    0.0.0.0         255.255.255.0   U     101    0        0 eth1
$ route -n
Kernel IP routing table
Destination     Gateway         Genmask         Flags Metric Ref    Use Iface
0.0.0.0         10.0.2.2        0.0.0.0         UG    100    0        0 eth0
10.0.2.0        0.0.0.0         255.255.255.0   U     100    0        0 eth0
192.168.33.0    0.0.0.0         255.255.255.0   U     101    0        0 eth1
とりあえず、共有フォルダに移動して、
$ cd /vagrant
index.phpを作成し、
$ vi index.php
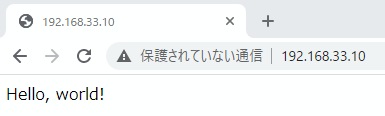
<?php
echo "Hello,";
echo " world";
echo "!";
PHPのビルドインサーバーを起動。
(なぜかsudoをつけないとpermission denyのエラーがでるので付けている)
$ sudo php -S 0.0.0.0:80
ブラウザからアクセスできることを確認。
ホスト側
VSCodeに「PHP Debug」の拡張機能をインストール。
メニューから[実行]-[構成の追加]を選んで「PHP」を選択し、
launch.jsonに、ポート番号とパスのマッピングを追加。
  // IntelliSense を使用して利用可能な属性を学べます。
  // 既存の属性の説明をホバーして表示します。
  // 詳細情報は次を確認してください: https://go.microsoft.com/fwlink/?linkid=830387
  "version": "0.2.0",
  "configurations": [
    {
      "name": "Listen for XDebug",
      "type": "php",
      "request": "launch",
      "port": 9003,
      "pathMappings": {
          "/vagrant": "${workspaceRoot}"
      }
    },
    {
      "name": "Launch currently open script",
      "type": "php",
      "request": "launch",
      "program": "${file}",
      "cwd": "${fileDirname}",
      "port": 9000
    }
  ]
}
ちなみに、リモート側からphp.iniに指定したホスト側のIPアドレス(xdebug.client_host)にアクセスが来るで、 launch.jsonにリモート側のIPアドレスは指定する必要はないみたい(よく分ってないが…)
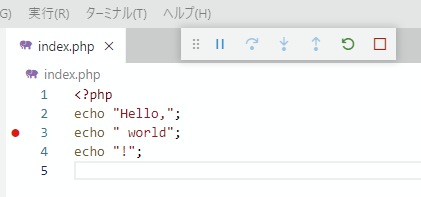
適当にブレークポイントを設定し、
[実行]-[デバッグの開始]
で、デバッグを始める。
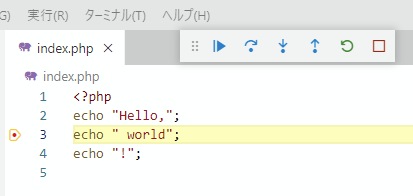
ブラウザからアクセスすると、
ブレークポイントで止まる。
補足
IDE等でデバッグ中じゃない場合に、PHPを実行すると、下記のエラーがでる。
Xdebug: [Step Debug] Time-out connecting to debugging claited: 200 ms. ・・・
下記の記事のよると、
https://laptrinhx.com/xdebug2no-she-dingwo3no-she-dingni-bian-huansuruyatsu-2897960755/
下記のような対処で解決できるみたい
export XDEBUG_MODE=off && php artinsan xxx
or
xdebug.log_level=0